Customizing Chart Data
You can customize the information shown on the charts when backtesting or monitoring your strategy during live trading.
TIP
During a live trading session, the chart is updated in real time, similar to other live charting solutions, allowing you to monitor your trading strategy.
1. Configuring the Chart Schema
In your sma_sample_strategy.py add imports for ChartSchema, ChartPointDataType, set_chart_schema, chart:
...
from superalgorithm.types import (
    Bar,
    OrderType,
    PositionType,
    ChartSchema,
    ChartPointDataType
)
...
from superalgorithm.utils.logging import set_chart_schema, chart
Create the chart schema in the init function. We will plot the candlesticks of the price data, and the moving averages.
class SMAStrategy(BaseStrategy):

    def init(self):
        self.on("5m", self.on_5)
        self.sma = SMA(14)
        self.sma_slow = SMA(200)

        set_chart_schema(
            [
                ChartSchema(
                    "BTC/USDT", ChartPointDataType.OHLCV, "candlestick", "orange"
                ),
                ChartSchema("sma", ChartPointDataType.FLOAT, "line", "red"),
                ChartSchema("sma_slow", ChartPointDataType.FLOAT, "line", "blue"),
            ]
        )
2. Populate Chart Data
We now populate the charts with data every time we receive an update in our 5m handler.
async def on_5(self, bar: Bar):
self.sma.add(bar.close)
self.sma_slow.add(bar.close)
chart("BTC/USDT", bar.ohlcv)
chart("sma", self.sma[-1])
chart("sma_slow", self.sma_slow[-1])
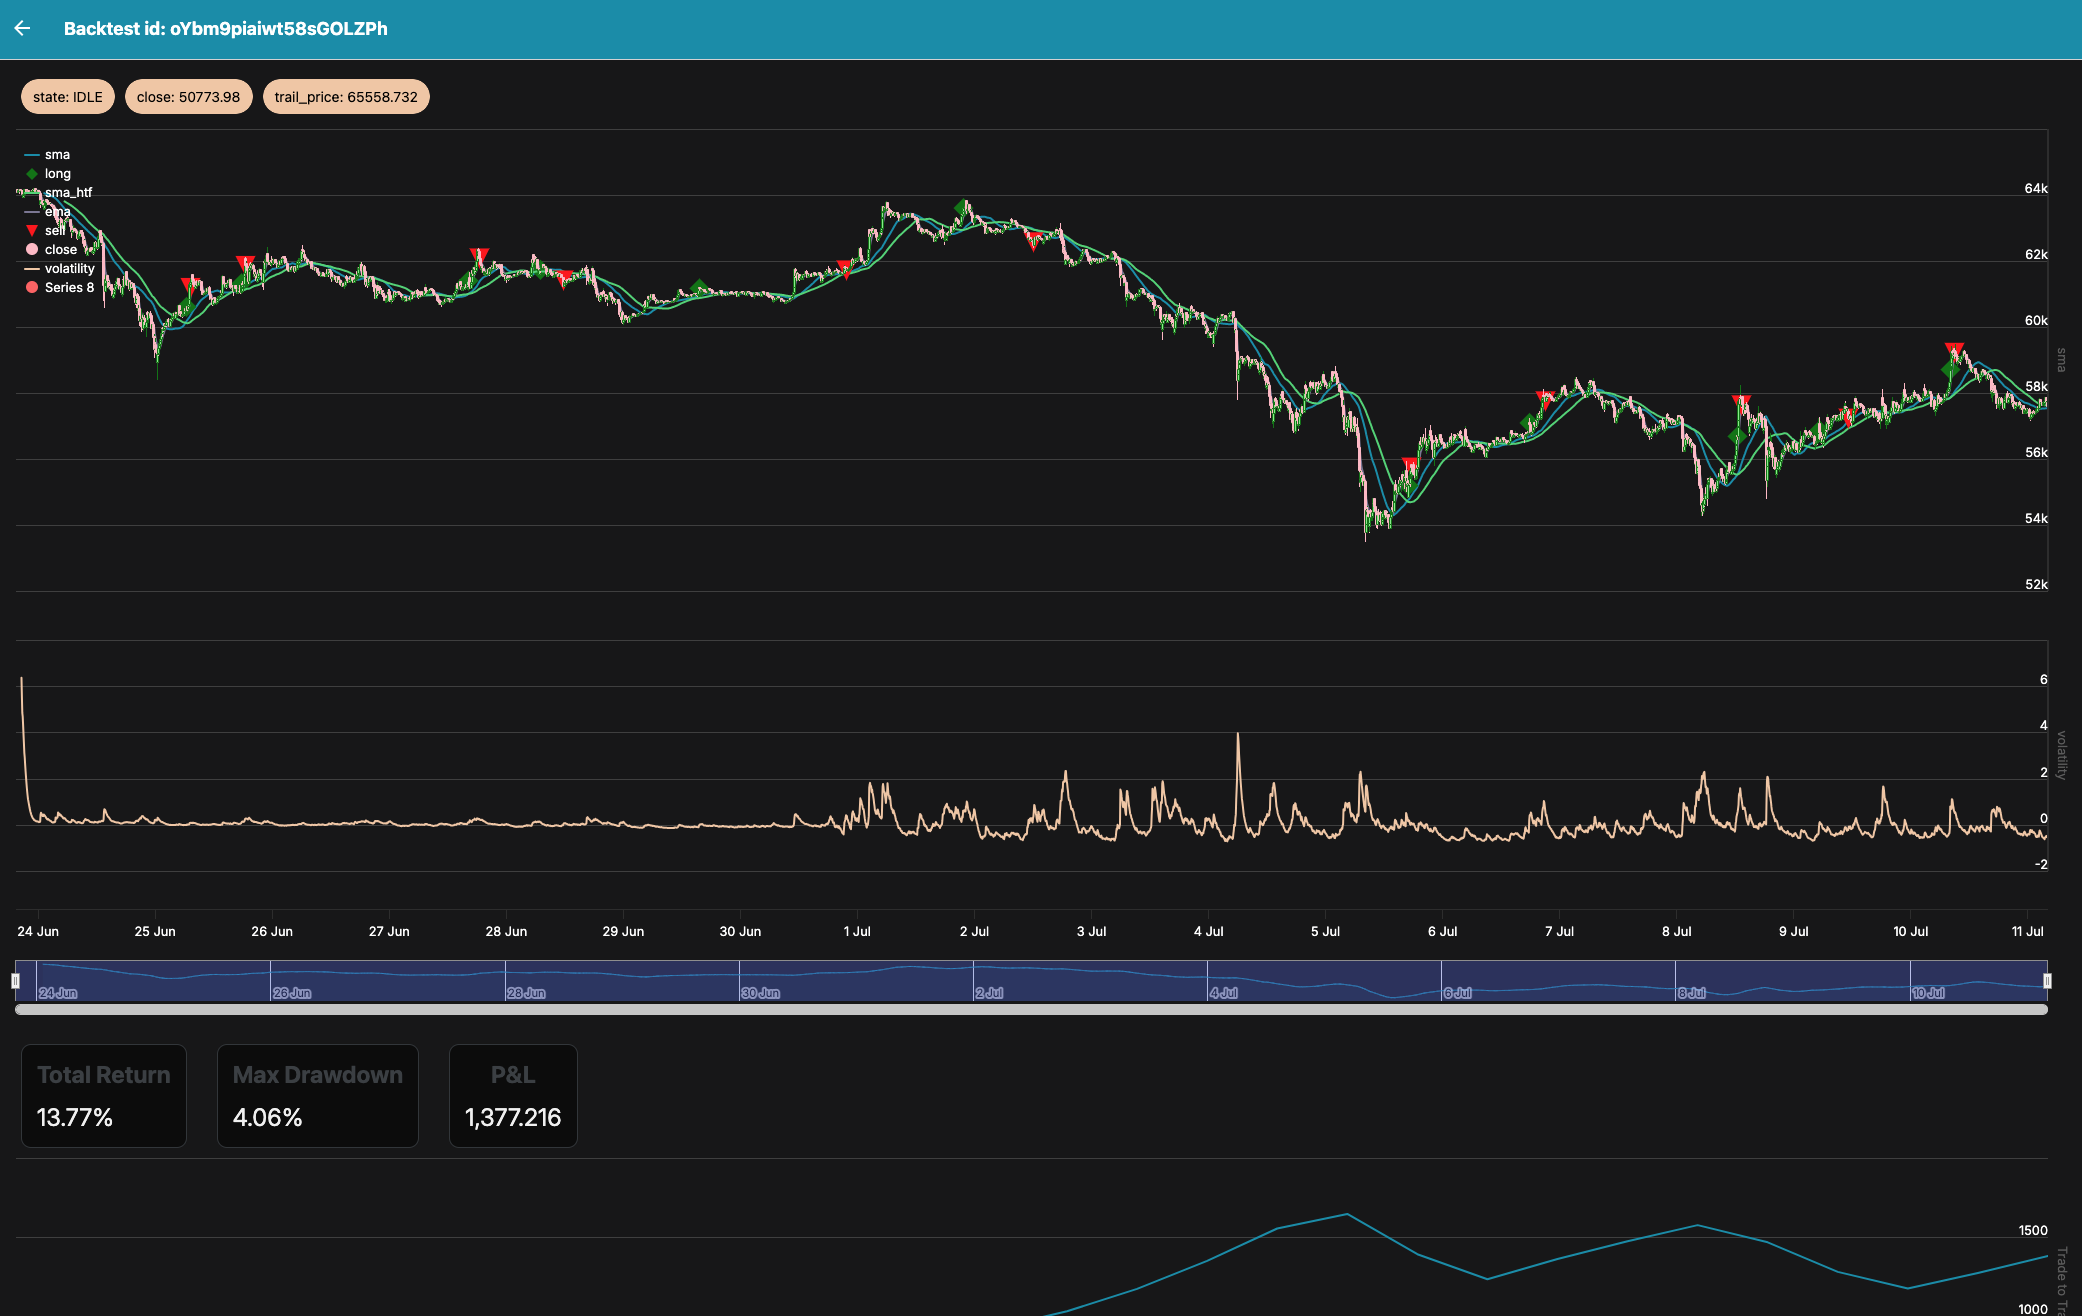
await self.trade_logic()3. Test the Chart
Now run your backtest.py again to see the chart:
SUPER_STRATEGY_ID=<choose a unique name for your strategy> backtest.py4. Adding entry and exit points
Inside the set_chart_schema function add two additional configurations of type scatter:
ChartSchema("long", ChartPointDataType.FLOAT, "scatter", chart_color="green"),
ChartSchema("short", ChartPointDataType.FLOAT, "scatter", chart_color="red"),
```
Then, modify the buy and sell code blocks to plot the scatter points when we go long or short.
    async def trade_logic(self):

        ...

        if buy:
            await self.open("BTC/USDT", PositionType.LONG, 0.1, OrderType.LIMIT, close)
            chart("long", close)

        if sell:
            await self.close("BTC/USDT", PositionType.LONG, 0.1, OrderType.LIMIT, close)
            chart("short", close)
Re-run your backtest to see the results.